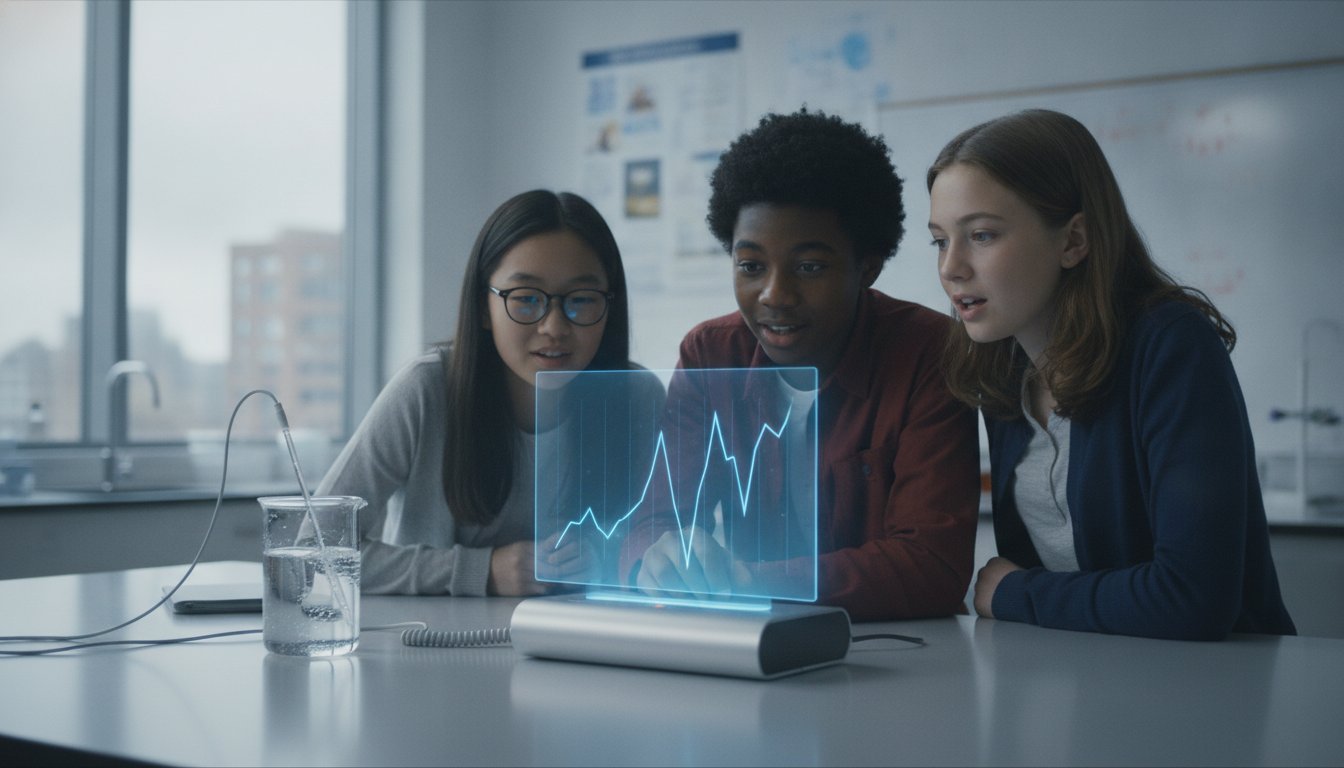
What if your students could actually “see” the invisible breath of a plant or the silent energy of a UV ray in real-time? Most educators agree that traditional data logging experiments for science class often get bogged down by manual errors and the ticking clock. It’s difficult to inspire future innovators when they’re stuck recording numbers by hand instead of witnessing the thrill of a live, reacting graph.
We believe technology should be a bridge, not a barrier. Following the March 2026 report from the National Academies emphasizing data competency, this guide shows you how to transform abstract concepts into tangible insights. You’ll discover how to use the MC 4.0 AIoT Kit and modular MC Blocks to streamline lab sessions and achieve higher student engagement. We’ll preview high-impact setups that move your students from basic observation to advanced, real-time inquiry while meeting modern curriculum standards with precision.
Key Takeaways
- Transition from static snapshots to dynamic scientific stories by automating high-frequency data collection in your lab.
- Visualize the invisible through precise monitoring of pH shifts, soil moisture, and thermodynamic reactions using real-time graphing.
- Leverage the modularity of MC Blocks to pivot quickly between physics and environmental studies without technical friction.
- Implement high-impact data logging experiments for science class that align with modern NGSS standards while boosting student engagement.
- Empower your teaching with the MC4.0 Controller, serving as a high-speed data hub for sophisticated STEM inquiry across all K-12 levels.
Why Data Logging is Essential for Modern Science Classrooms
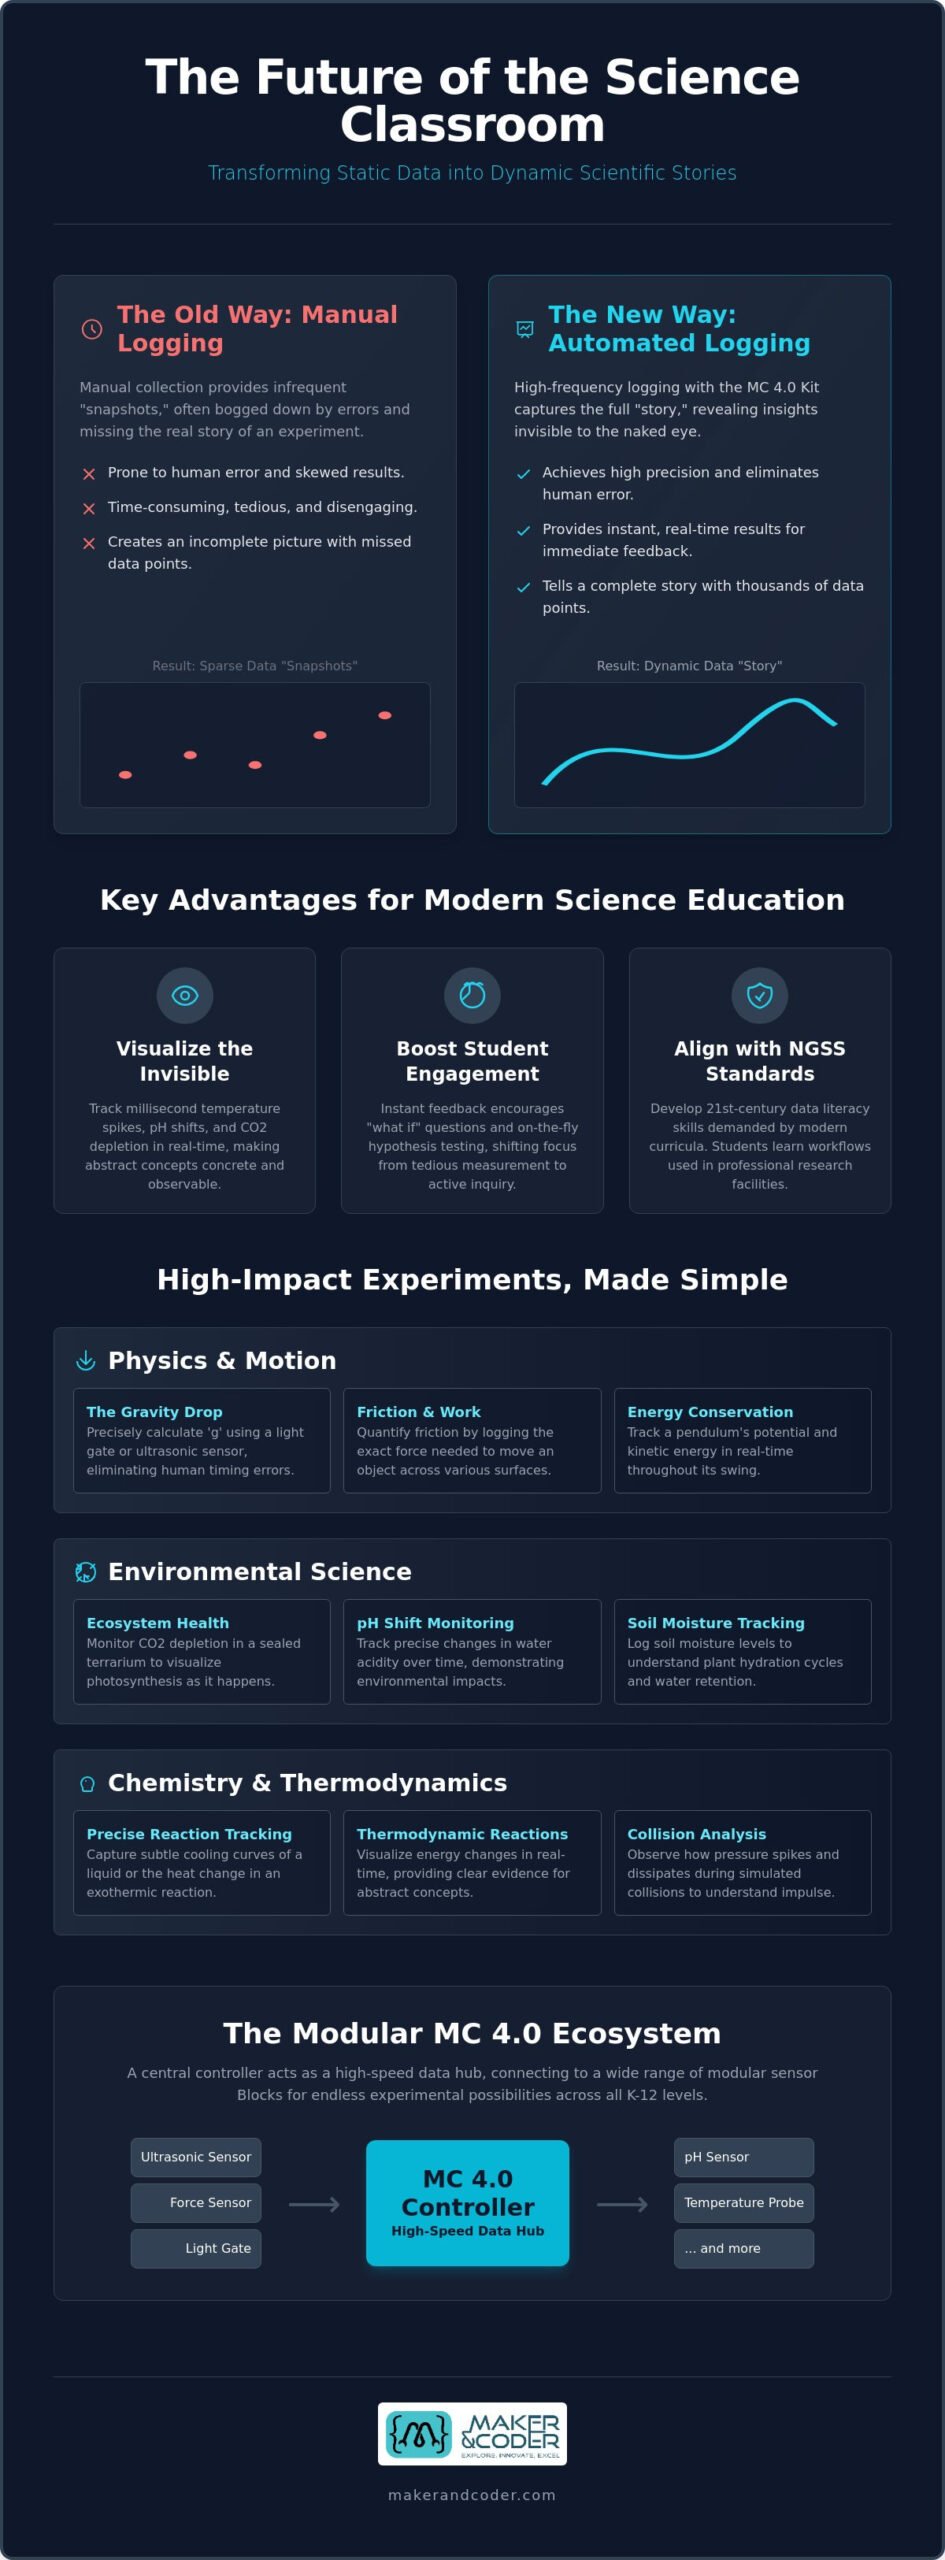
Science education is evolving from simple observation to high-frequency analysis. A data logger is an electronic device that records data over time, providing a level of precision that manual tools simply cannot match. In the classroom, this means moving beyond manual stopwatches and paper logs. Automated systems capture hundreds of data points in the time it takes a student to blink. This precision transforms how we conduct data logging experiments for science class, turning static labs into dynamic investigations.
Manual collection typically gives us “snapshots,” which are single points on a graph that often miss the nuance of a reaction. High-frequency logging tells the “story” of the experiment. It captures the subtle cooling curve of a liquid or the frantic acceleration of a falling object. By removing the burden of manual measurement, we eliminate the human error that often leads to frustration and skewed results. Students spend less time squinting at rulers and more time interpreting the narrative of the data. This shift is essential for meaningful data logging experiments for science class, as it allows students to focus on the “why” rather than the “how.”
Visualizing the Invisible in Real-Time
The human eye is limited. It can’t track a millisecond temperature spike or the gradual depletion of CO2 in a sealed terrarium. Digital tools bridge this gap. When students see a line climb or dip instantly on a screen, the abstract becomes concrete. This immediate feedback loop is powerful. It invites curiosity. If a student adjusts a light source, they see the impact on a photosynthesis graph immediately. This “instant-action” environment encourages them to ask “What if?” and test new hypotheses on the fly. It’s the difference between reading about science and witnessing it happen in real-time.
Aligning with 21st-Century STEM Standards
Modern standards demand more than just rote memorization. They require data literacy. By using the MC4.0 Controller and modular MC Blocks, students engage with the same workflows found in professional research facilities. They learn to clean data, identify outliers, and synthesize information across disciplines. This integration of mathematics and science is seamless. Automated graphing allows for immediate classroom discussion, shifting the focus from “How do we draw this?” to “What does this mean for our world?”. Preparing students for 2026 and beyond requires these digital competencies. You can find the necessary hardware to start this journey in our online shop.
Physics and Motion: Kinetic Experiments for Middle School
Motion is often too fast for the human eye to measure with any degree of accuracy. By utilizing high-speed sensors, students can visualize acceleration curves as they happen, turning a simple toy car roll into a professional-grade analysis of kinematics. According to NASA on K-12 data literacy, these competencies are vital for future STEM success. Implementing data logging experiments for science class allows students to move from guessing how fast an object is moving to proving it with millisecond precision.
Beyond basic speed, middle schoolers can explore the conservation of energy through hands-on modeling. A pendulum experiment becomes much more than a swinging weight when an ultrasonic sensor tracks its potential and kinetic energy throughout the arc. Similarly, tracking force during simulated collisions helps students understand impulse. They can see the impact of crumple zones in real-time, observing how pressure spikes and dissipates on their screens. This level of detail transforms a passive demonstration into an active investigation where students own the results.
The Gravity Drop: Calculating ‘g’ with Precision
Measuring gravity is a fundamental rite of passage in the science lab. Students often struggle with manual timing errors that lead to wild results, but using a light gate or the MC4.0 Controller with an ultrasonic block removes the human lag. They can drop a mass and watch the software calculate the acceleration due to gravity. While the textbook says 9.8 m/s², the real-world data might show 9.7 or 9.6. This discrepancy opens a brilliant door for discussion. Is it air resistance? Is it sensor calibration? This is where the real scientific method begins.
Friction and Work: A Modular Approach
Friction is usually an invisible “thief” of energy that students struggle to quantify. With the modular MC Blocks, you can attach a force sensor to a weighted sled and pull it across various surfaces. Students can log the exact Newtons required to overcome static friction on sandpaper versus smooth plastic or wood. The software then generates a “Work vs. Distance” graph automatically. It’s a clean, efficient way to illustrate that more friction equals more energy expenditure. If you’re looking for ways to integrate these specific sensors into your existing lab, you can reach out to our education team for a tailored implementation plan.
Environmental Science: Tracking Ecosystem Health
Environmental science often moves at a pace that escapes human observation. While a physics lab might conclude in seconds; ecological shifts occur over hours, days, or even weeks. This is where data logging experiments for science class provide a critical advantage. By deploying the MC 4.0 AIoT Kit, students transform their immediate surroundings into a sophisticated, living laboratory. They can monitor CO2 levels and air quality variations throughout the school day, witnessing exactly how human presence and ventilation systems alter their environment in real-time.
The depth of inquiry increases when students analyze water quality from local sources. Using high-precision probes connected to the MC4.0 Controller, they track pH and turbidity levels over extended periods. This longitudinal approach allows them to identify subtle trends and anomalies that a single, manual test would overlook. Because the MC Blocks are modular, teachers can quickly pivot from measuring light intensity in a terrarium to tracking soil moisture levels across different classroom micro-climates. This versatility ensures that the technology keeps pace with the curiosity of the learners.
Soil moisture monitoring offers another layer of discovery. Students can compare how different soil compositions, such as sand, clay, or compost, retain water over several days. This data-driven approach to botany replaces guesswork with evidence. It helps students understand the delicate balance required for sustainable agriculture and ecosystem stability. By logging these variables, students don’t just study nature; they quantify its vital signs.
The 24-Hour Classroom Climate Study
Configure your logger to record temperature and humidity every 10 minutes over a full 24-hour cycle. When students return the next morning, they’re greeted by a complete “heating curve” of their classroom. They can see the sharp rise in temperature as classmates enter and the gradual cooling after the final bell. This data serves as a powerful starting point for discussions on energy efficiency and modern building design. It grounds global environmental challenges in the physical reality of their own school.
Photosynthesis in Action
Capturing the silent “breath” of a plant requires constant, automated vigilance. By placing a seedling in a sealed container with CO2 and oxygen sensors, students can observe gas exchange as it happens. Logging data overnight reveals the “Dark Cycle,” demonstrating how plants shift their respiration when the sun sets. Higher light intensity levels directly correlate with an increased rate of oxygen production as recorded by the data logging sensors. This experiment provides a visceral link between solar energy and chemical output, making the complex mechanics of photosynthesis accessible and engaging. You can find these specialized sensor sets in our online shop to begin your own ecosystem studies.
Chemistry and Thermodynamics: Precise Reaction Tracking
Chemistry often feels abstract to students because they cannot witness the microscopic exchange of energy. Traditional labs rely on visual cues like color changes or bubbles, which are qualitative rather than quantitative. By integrating data logging experiments for science class, you provide students with the high-precision probes needed to track molecular activity in real-time. Whether it’s monitoring the heat of an exothermic reaction or the subtle pH shift during a titration, digital tools turn invisible chemical processes into vivid, actionable data.
Phase changes offer another excellent opportunity for continuous logging. When students heat ice to a boil, they often expect a constant rise in temperature. Seeing the “plateau” during melting and boiling on a live graph challenges their assumptions. It forces them to grapple with the concept of latent heat. Similarly, measuring gas pressure build-up during a reaction allows classes to calculate reaction rates with professional accuracy. They can experiment with catalysts or surface area and see the immediate impact on the pressure curve. This level of detail builds the “expert-as-enabler” mindset, where technology supports deep inquiry.
The Vinegar and Baking Soda Heat Map
Start with a simple temperature block to capture the classic endothermic reaction between vinegar and baking soda. Students often miss the immediate temperature drop when using manual thermometers, but a data logger captures every fraction of a degree. Overlaying multiple trials allows the class to see how changing the concentration of reactants affects the depth of the thermal dip. They can identify the exact moment the reaction reaches equilibrium, providing a clear visual end-point that a bubbling beaker cannot signal on its own.
Conductivity and Concentration
Move from temperature to electrical properties by logging conductivity as salt is added to water. This experiment helps students visualize the “saturation point” through a distinct plateau in the data graph. As they add more solute, the conductivity rises until the water can no longer hold more ions; at this point, the line flattens. It’s a powerful way to connect chemical properties to digital readings, ensuring students understand the relationship between matter and energy. If you’re ready to upgrade your chemistry lab with these capabilities, contact our STEM specialists today for a consultation on the MC 4.0 ecosystem.
Implementing Data Logging with the MC 4.0 Ecosystem
The transition from manual recording to digital inquiry requires a robust foundation. In the MC 4.0 ecosystem, the MC4.0 Controller functions as the central nervous system for your lab. It’s a high-speed data hub that processes sensor inputs with the precision required for professional-grade research. By centralizing the technology, we move students from being passive observers to active system designers. They don’t just watch a screen; they manage the flow of information. This architecture ensures that data logging experiments for science class remain focused on discovery rather than troubleshooting hardware.
Modularity is the cornerstone of a flexible classroom. With MC Blocks, you can swap a temperature probe for an ultrasonic sensor in seconds. This allows a single kit to pivot from the chemistry titrations discussed earlier to the physics motion studies without missing a beat. It’s a “plug-and-play” experience that respects the limited time of a class period. This modularity also allows for the creation of custom sensor arrays, empowering students to design their own unique data logging experiments for science class based on their specific research questions.
We’re also bridging the gap between local labs and global collaboration. The MC 4.0 AIoT Kit integrates Internet of Things (IoT) capabilities, allowing students to send their real-time data to cloud platforms like Azure or AWS. Imagine a class in London comparing their 24-hour climate study data with a partner school in Tokyo. This connectivity aligns with the March 2026 National Academies report emphasizing the integration of computing and data competencies. It’s no longer just about the experiment in front of them; it’s about participating in a global scientific community.
From Data Logging to Python Coding
Growth is a journey from observation to automation. Once students master basic logging, they can begin writing scripts that trigger physical actions based on data. For instance, they might program a cooling fan to activate when a chemical reaction hits a specific temperature. Using the MC 4.0 Kit, learners transition from Scratch to Python, building their own automated lab assistants. This progression empowers them to create custom logging software tailored to their own innovative designs.
Teacher Support and Curriculum Alignment
We understand that implementation anxiety can be a hurdle for non-technical educators. That’s why our ecosystem includes the pre-structured K-12 MC Curriculum, which aligns directly with NGSS standards. This ready-made solution reduces prep time and provides a clear pathway for every grade level. To ensure total confidence, our teacher training programs help you master the hardware and software in a single session. You can browse the latest STEM kits and MC Blocks to find the perfect configuration for your school’s unique needs.
Empowering the Next Generation of Scientific Explorers
The journey from abstract concepts to tangible discoveries starts with the right tools. By integrating data logging experiments for science class, you move your students beyond simple observation into the realm of professional-grade analysis. They don’t just learn about the world; they quantify it. Our modular MC Blocks offer over 20 sensor types to ensure your lab stays versatile across physics, chemistry, and environmental science. This modularity allows you to pivot between grade levels and subjects with ease, maximizing the impact of every lesson.
We’re here to be your dedicated partner in this technological transformation. With our K-12 Aligned Curriculum and professional teacher training included, you’ll have the structured support needed to lead with confidence. Equip your science lab with the MC 4.0 Ecosystem today and spark a lifelong passion for discovery in your students. The future is waiting for them to build it, and it’s time to give them the data-driven insights they need to lead the way.
Frequently Asked Questions
What is the difference between a sensor and a data logger?
A sensor is the specific component that detects a physical property, such as temperature or light intensity. A data logger, like the MC4.0 Controller, is the hardware that records and stores those detected values over time. While a sensor gives you a single snapshot, the logger creates a continuous narrative. This allows students to visualize trends and fluctuations that would be impossible to capture through manual observation alone.
Can I use data logging for remote or outdoor science experiments?
Yes, modern tools are built for mobility. The MC 4.0 AIoT Kit allows you to capture data in the field and sync it to the cloud for remote collaboration. This portability is perfect for tracking environmental changes in real-time or monitoring ecosystem health over several days. You don’t have to be tethered to a desktop; the technology moves with the learner into any environment.
How do I integrate data logging into an existing science curriculum?
Integration is most effective when you replace manual measurement tasks with automated ones. You don’t need to rewrite your entire syllabus; instead, use the K-12 MC Curriculum to find pre-structured lessons that align with your existing goals. This ensures that data logging experiments for science class enhance your teaching rather than complicating it. Professional teacher training is also available to help you master the transition quickly.
What age group is best suited for data logging in the classroom?
Data logging is versatile enough to span all K-12 levels. Elementary students use it for simple “high-low” observations, such as tracking daily temperature changes. Middle schoolers begin analyzing kinetic energy and motion, while high school students use the MC4.0 Controller for complex system design and Python-based data analysis. The technology grows with the student, providing an accessible entry point for every age group.
Do I need coding knowledge to use the MC 4.0 for data logging?
No prior coding knowledge is required to begin. The MC 4.0 ecosystem is designed for “plug-and-play” functionality, allowing teachers and students to start graphing data immediately. As confidence grows, the system provides a pathway into Scratch and Python. This “expert-as-enabler” approach allows you to focus on the science first, introducing computational thinking as a natural extension of the experiment.
How does data logging improve student learning outcomes in STEM?
It shifts the focus from tedious manual recording to high-level data interpretation. When students aren’t bogged down by manual errors, they have more time to ask “What if?” and test new hypotheses. Seeing real-time results helps them develop a deeper conceptual understanding of “invisible” phenomena. This immediate feedback loop is essential for building the critical thinking skills required for 21st-century scientific inquiry.
Is data logging equipment difficult to maintain for schools?
The modular design of MC Blocks makes maintenance remarkably simple. Since sensors are separate from the main controller, you only need to replace or upgrade specific blocks as your needs change. This modularity reduces long-term costs and implementation anxiety. Our teacher training programs also ensure that staff feel fully supported and capable of managing the hardware within a standard lab environment.
Can I export data from a logger to Excel or Google Sheets for analysis?
Yes, data export is a standard feature that connects the lab to the digital world. This functionality allows students to perform advanced statistical analysis and create professional reports. Mastering this process is a key benefit of data logging experiments for science class, as it prepares learners for the data-heavy environments they’ll encounter in higher education and professional STEM careers.